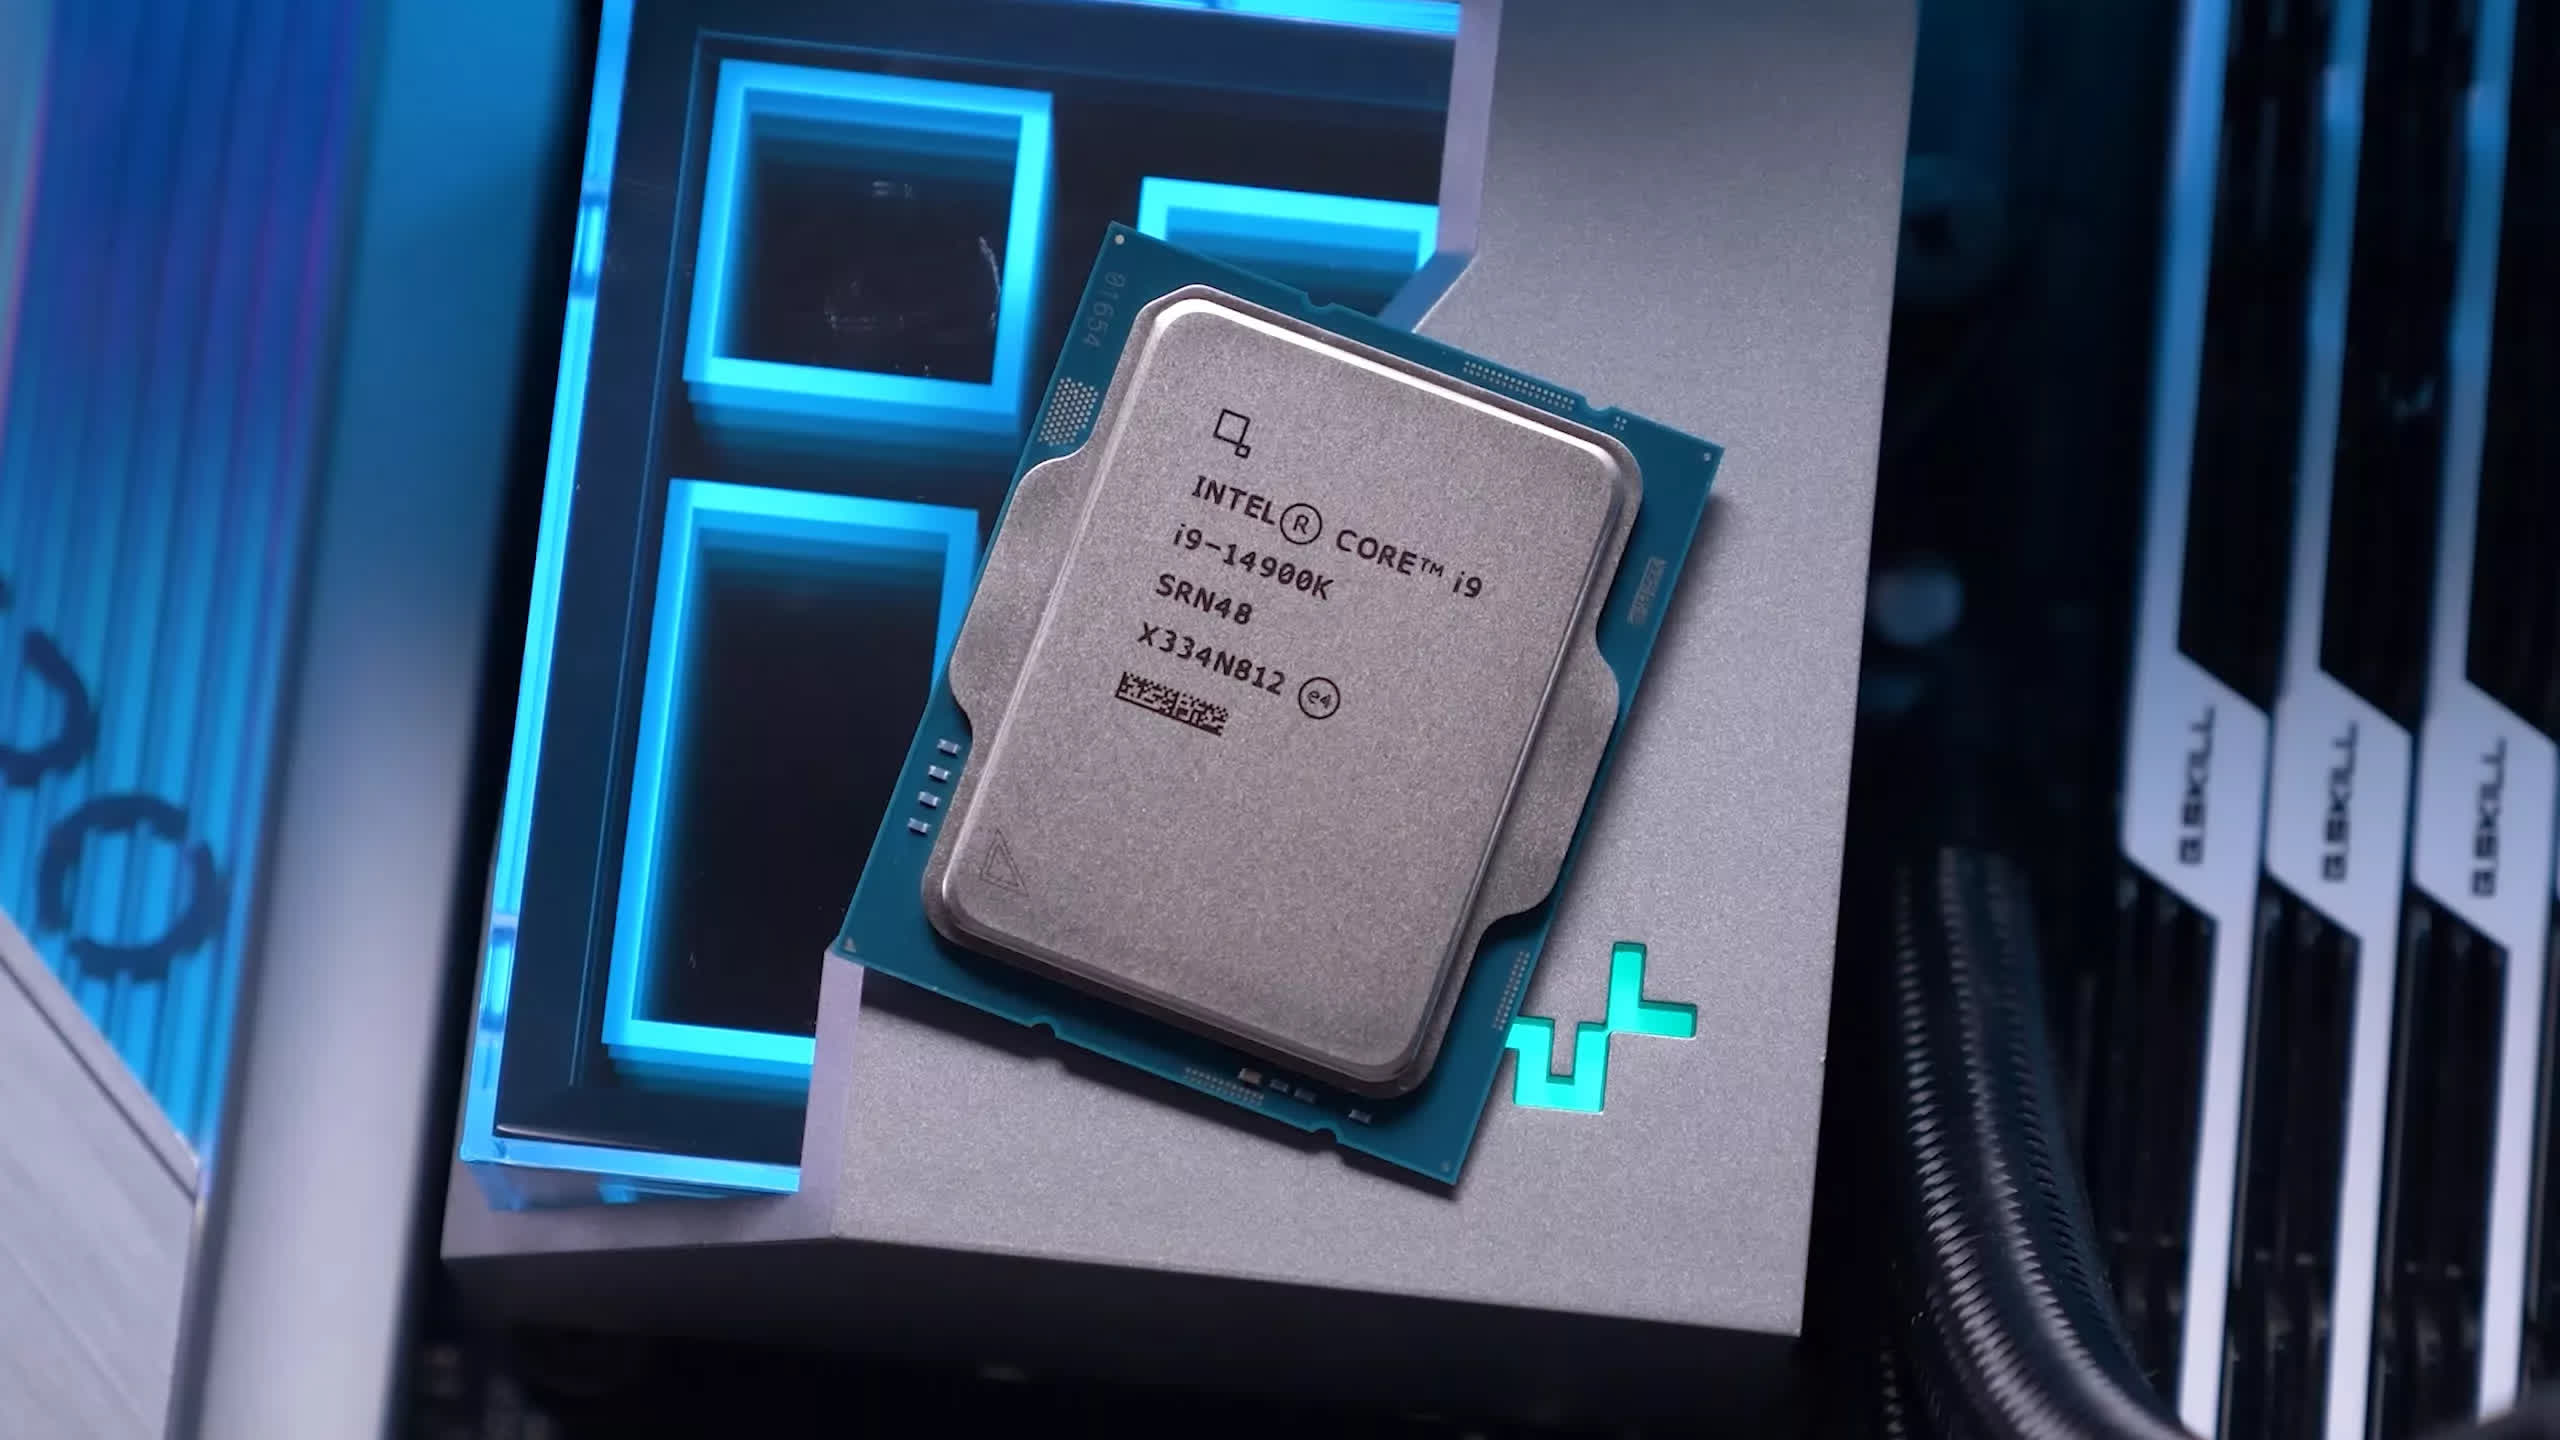
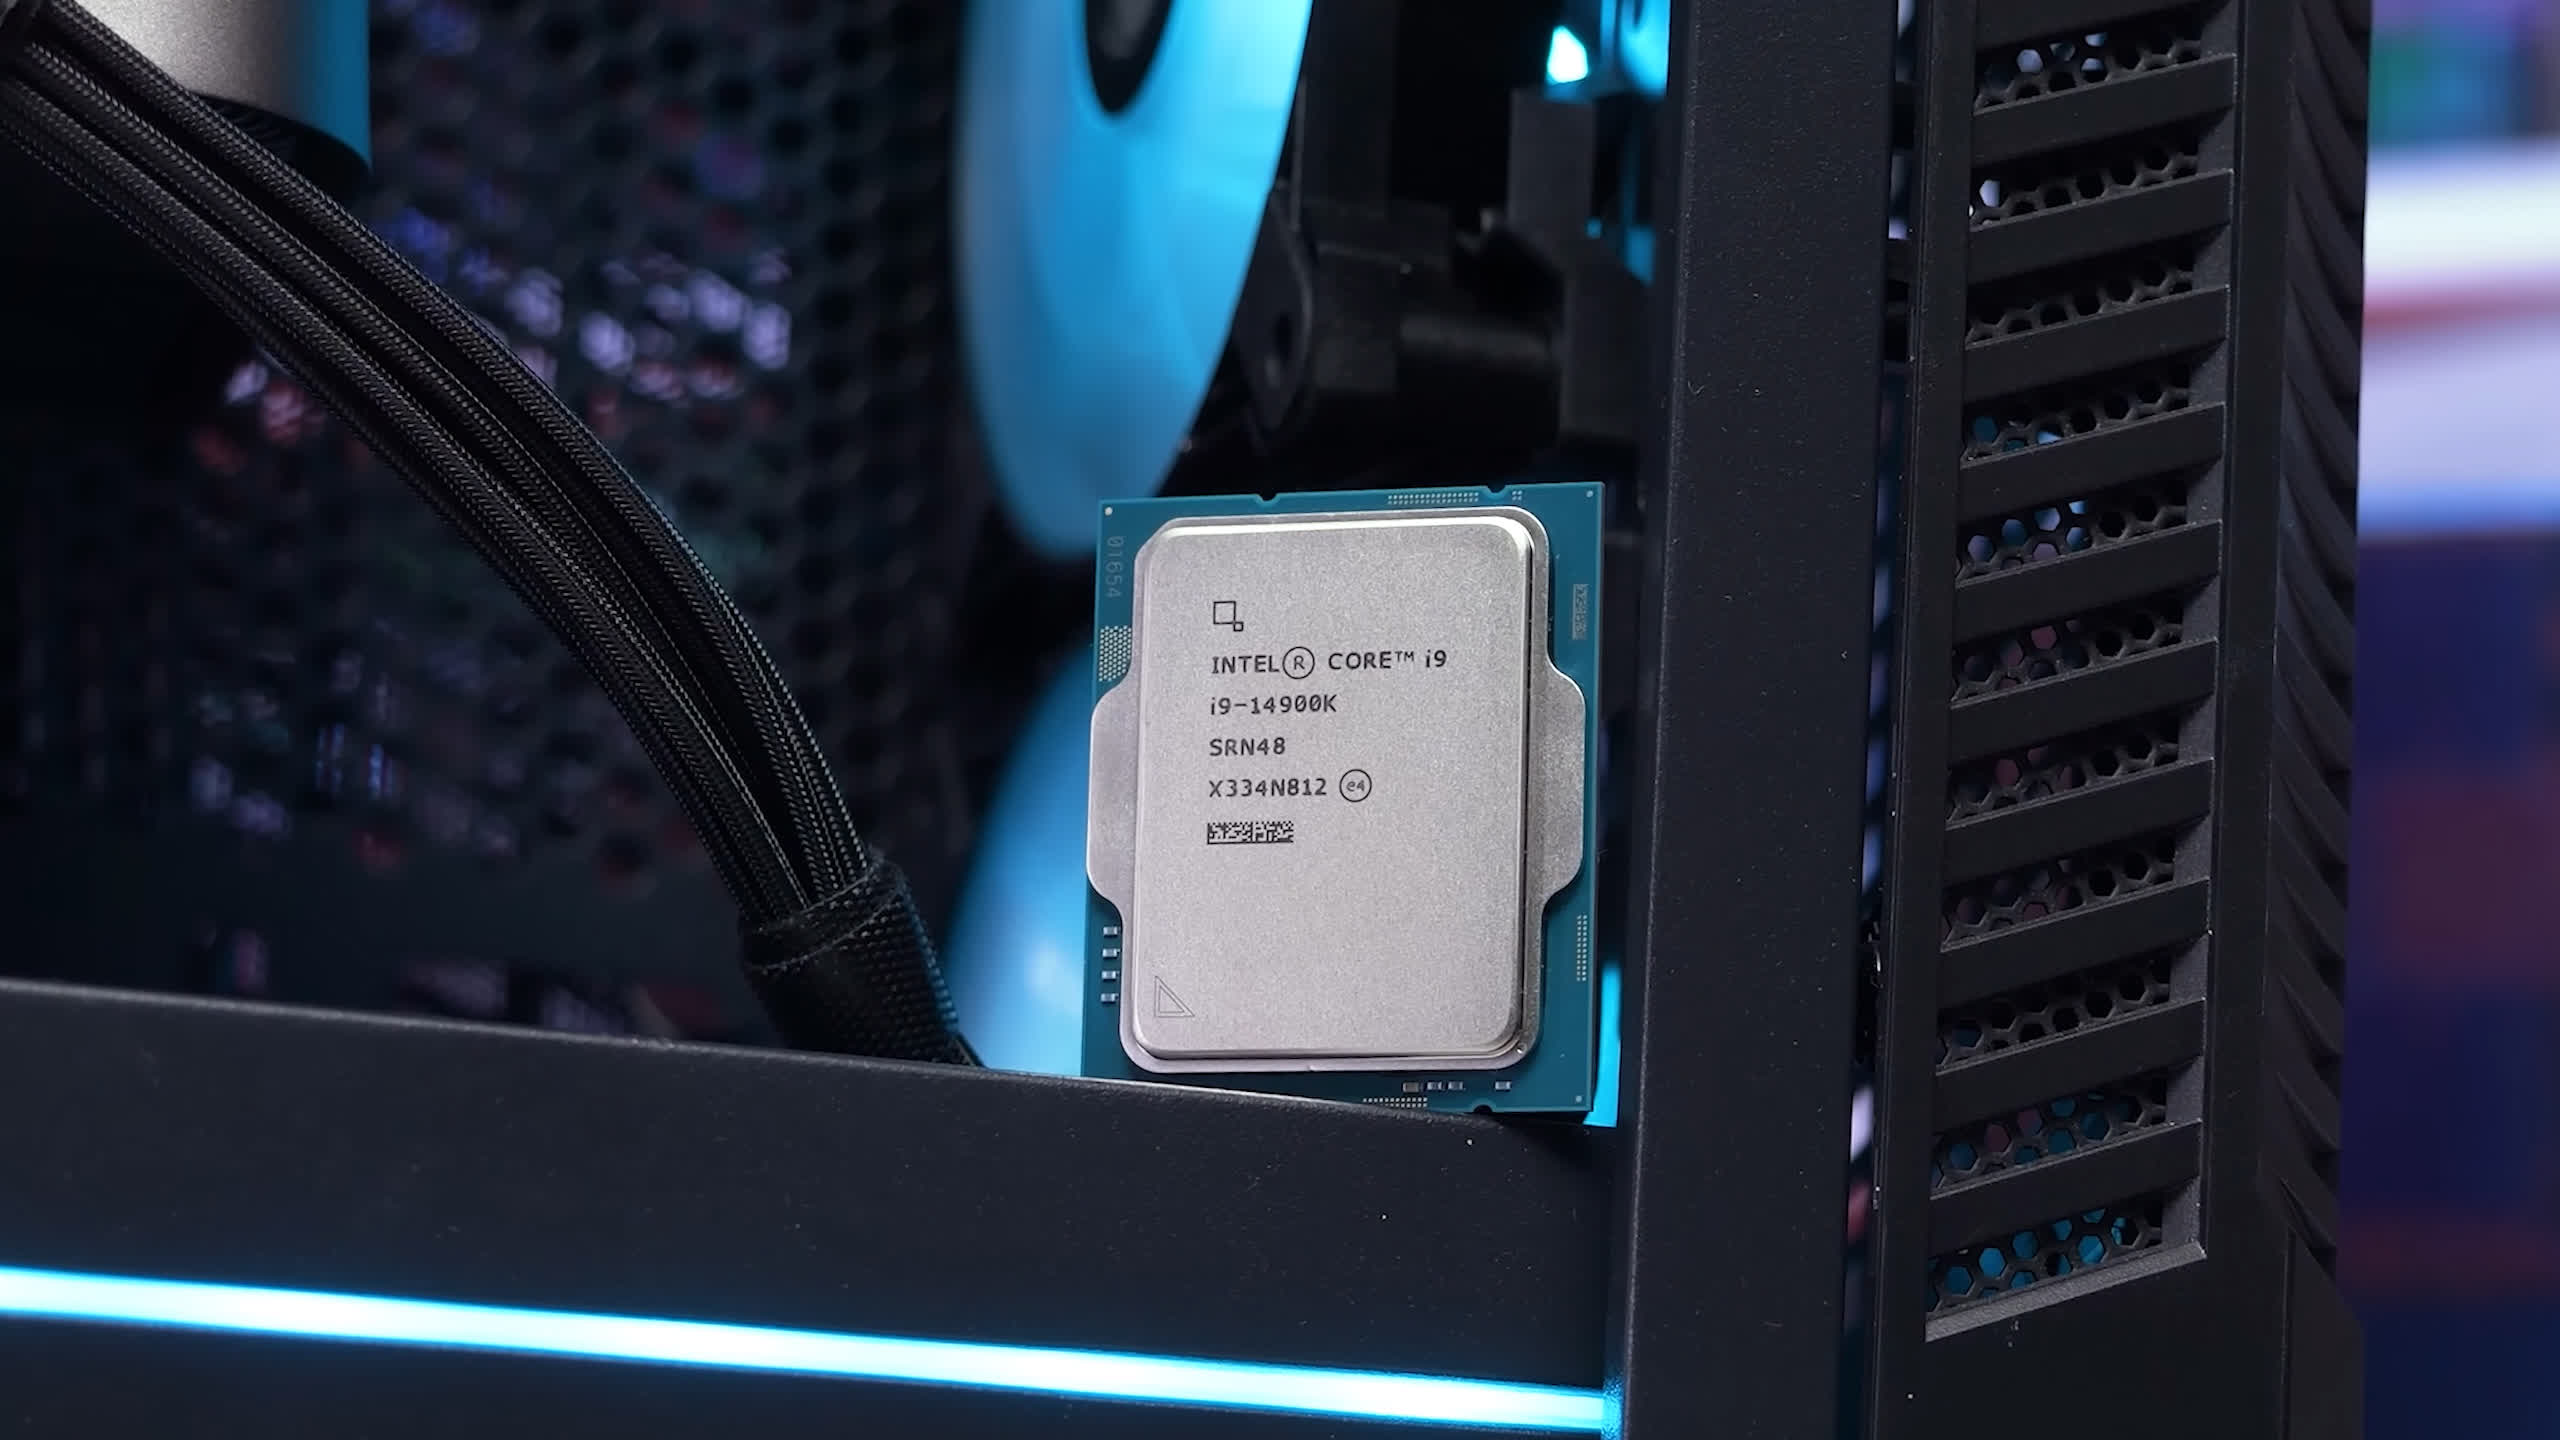
We’re going to assume that at this point you’re aware of the stability issues Intel and its partners have encountered with some 13th and 14th-gen processors, particularly the Core i9-13900K and 14900K. The simplest explanation is this: Intel doesn’t clearly communicate the default operating specifications for their CPUs to their partners. Instead, they provide a set of guidelines, but even those are merely guidelines. Board makers have had the freedom to do as they please, and indeed, they have.
Unlike AMD, Intel doesn’t certify motherboards, despite their logo being on the box. With no enforced specifications, whether for power limits or safety settings, the entire platform has become somewhat chaotic. We recently spoke with several of Intel’s partners, which provided us valuable insights into the issue. A number of engineers were quite willing to share details.
We’ve started to understand what happened and how Intel plans to address it—or rather, deflect any blame. We’ve also observed numerous BIOS updates being rolled out for LGA 1700 motherboards. However, despite Intel promising users that this mess would be resolved by the end of May, that never really happened.
Intel’s Power Profiles Clarified
That said, we have at least received some clarification on what board partners will implement moving forward. It appears that the Core i9 parts, such as the 13900K and 14900K, will run at 253 watts for PL1 and PL2, despite some Z790 boards running the Intel ‘performance’ profile by default with their latest beta BIOS revisions. The performance profile will reduce the long-duration power limit to just 125 watts, resulting in around a 15% performance loss for core-heavy workloads compared to 253 watts.
Intel has communicated to board partners that setting PL1 to 125 watts is considered “standard,” while 253 watts is “recommended.” Initially, MSI set 125 watts as their default profile. At the time of writing this article, that’s still the case, but they have informed us they will opt for the recommended 253 watts in a future BIOS update.
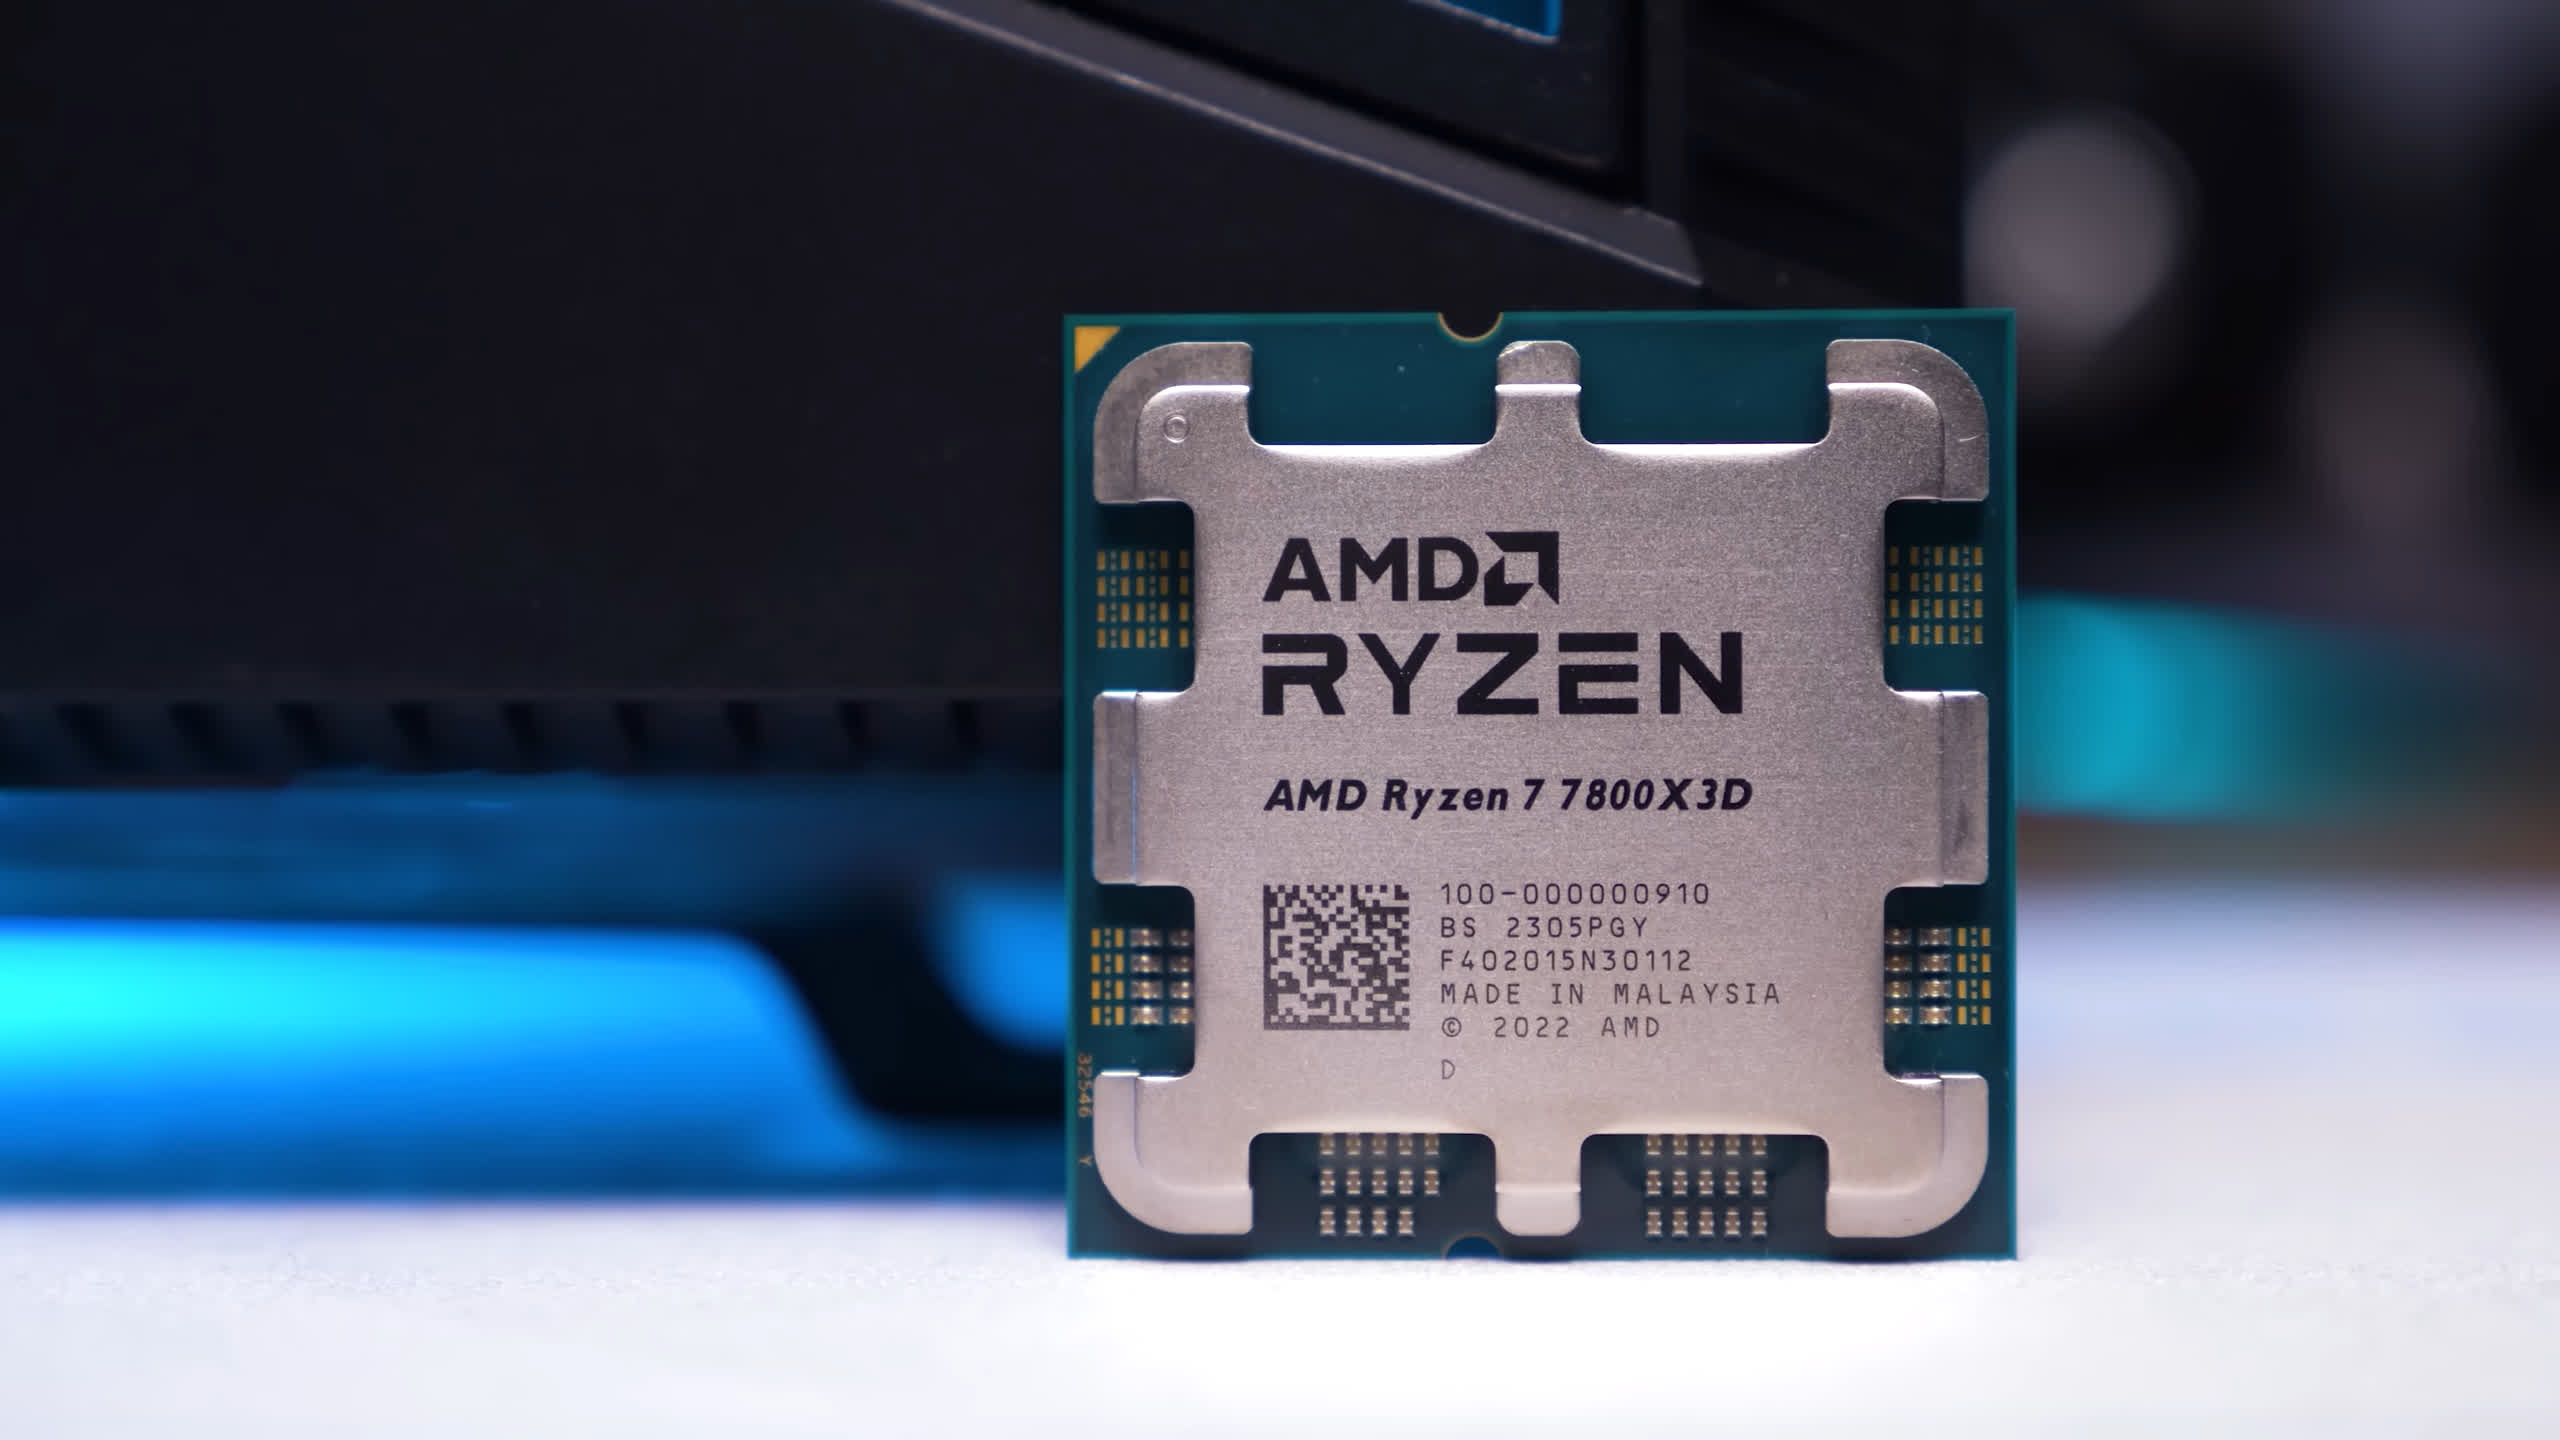
So, months later, we finally have some power profiles from Intel, though it’s not entirely clear how they will be implemented yet. Therefore, we’ve decided to benchmark the gaming performance of both the “performance” and “extreme” profiles using the Core i9-14900K and compare that data with the Ryzen 7 7800X3D.
About a month ago, we did a similar test, but at that time, it was unclear what would happen. We didn’t test the performance profile as it wasn’t a thing at the time; we still needed to hear from Intel. Even though our findings were accurate, we didn’t want to risk confusing readers with outdated information.
This updated version should be it. Regardless of how LGA1700 boards end up being configured, they will likely use either Intel’s performance or extreme profiles.
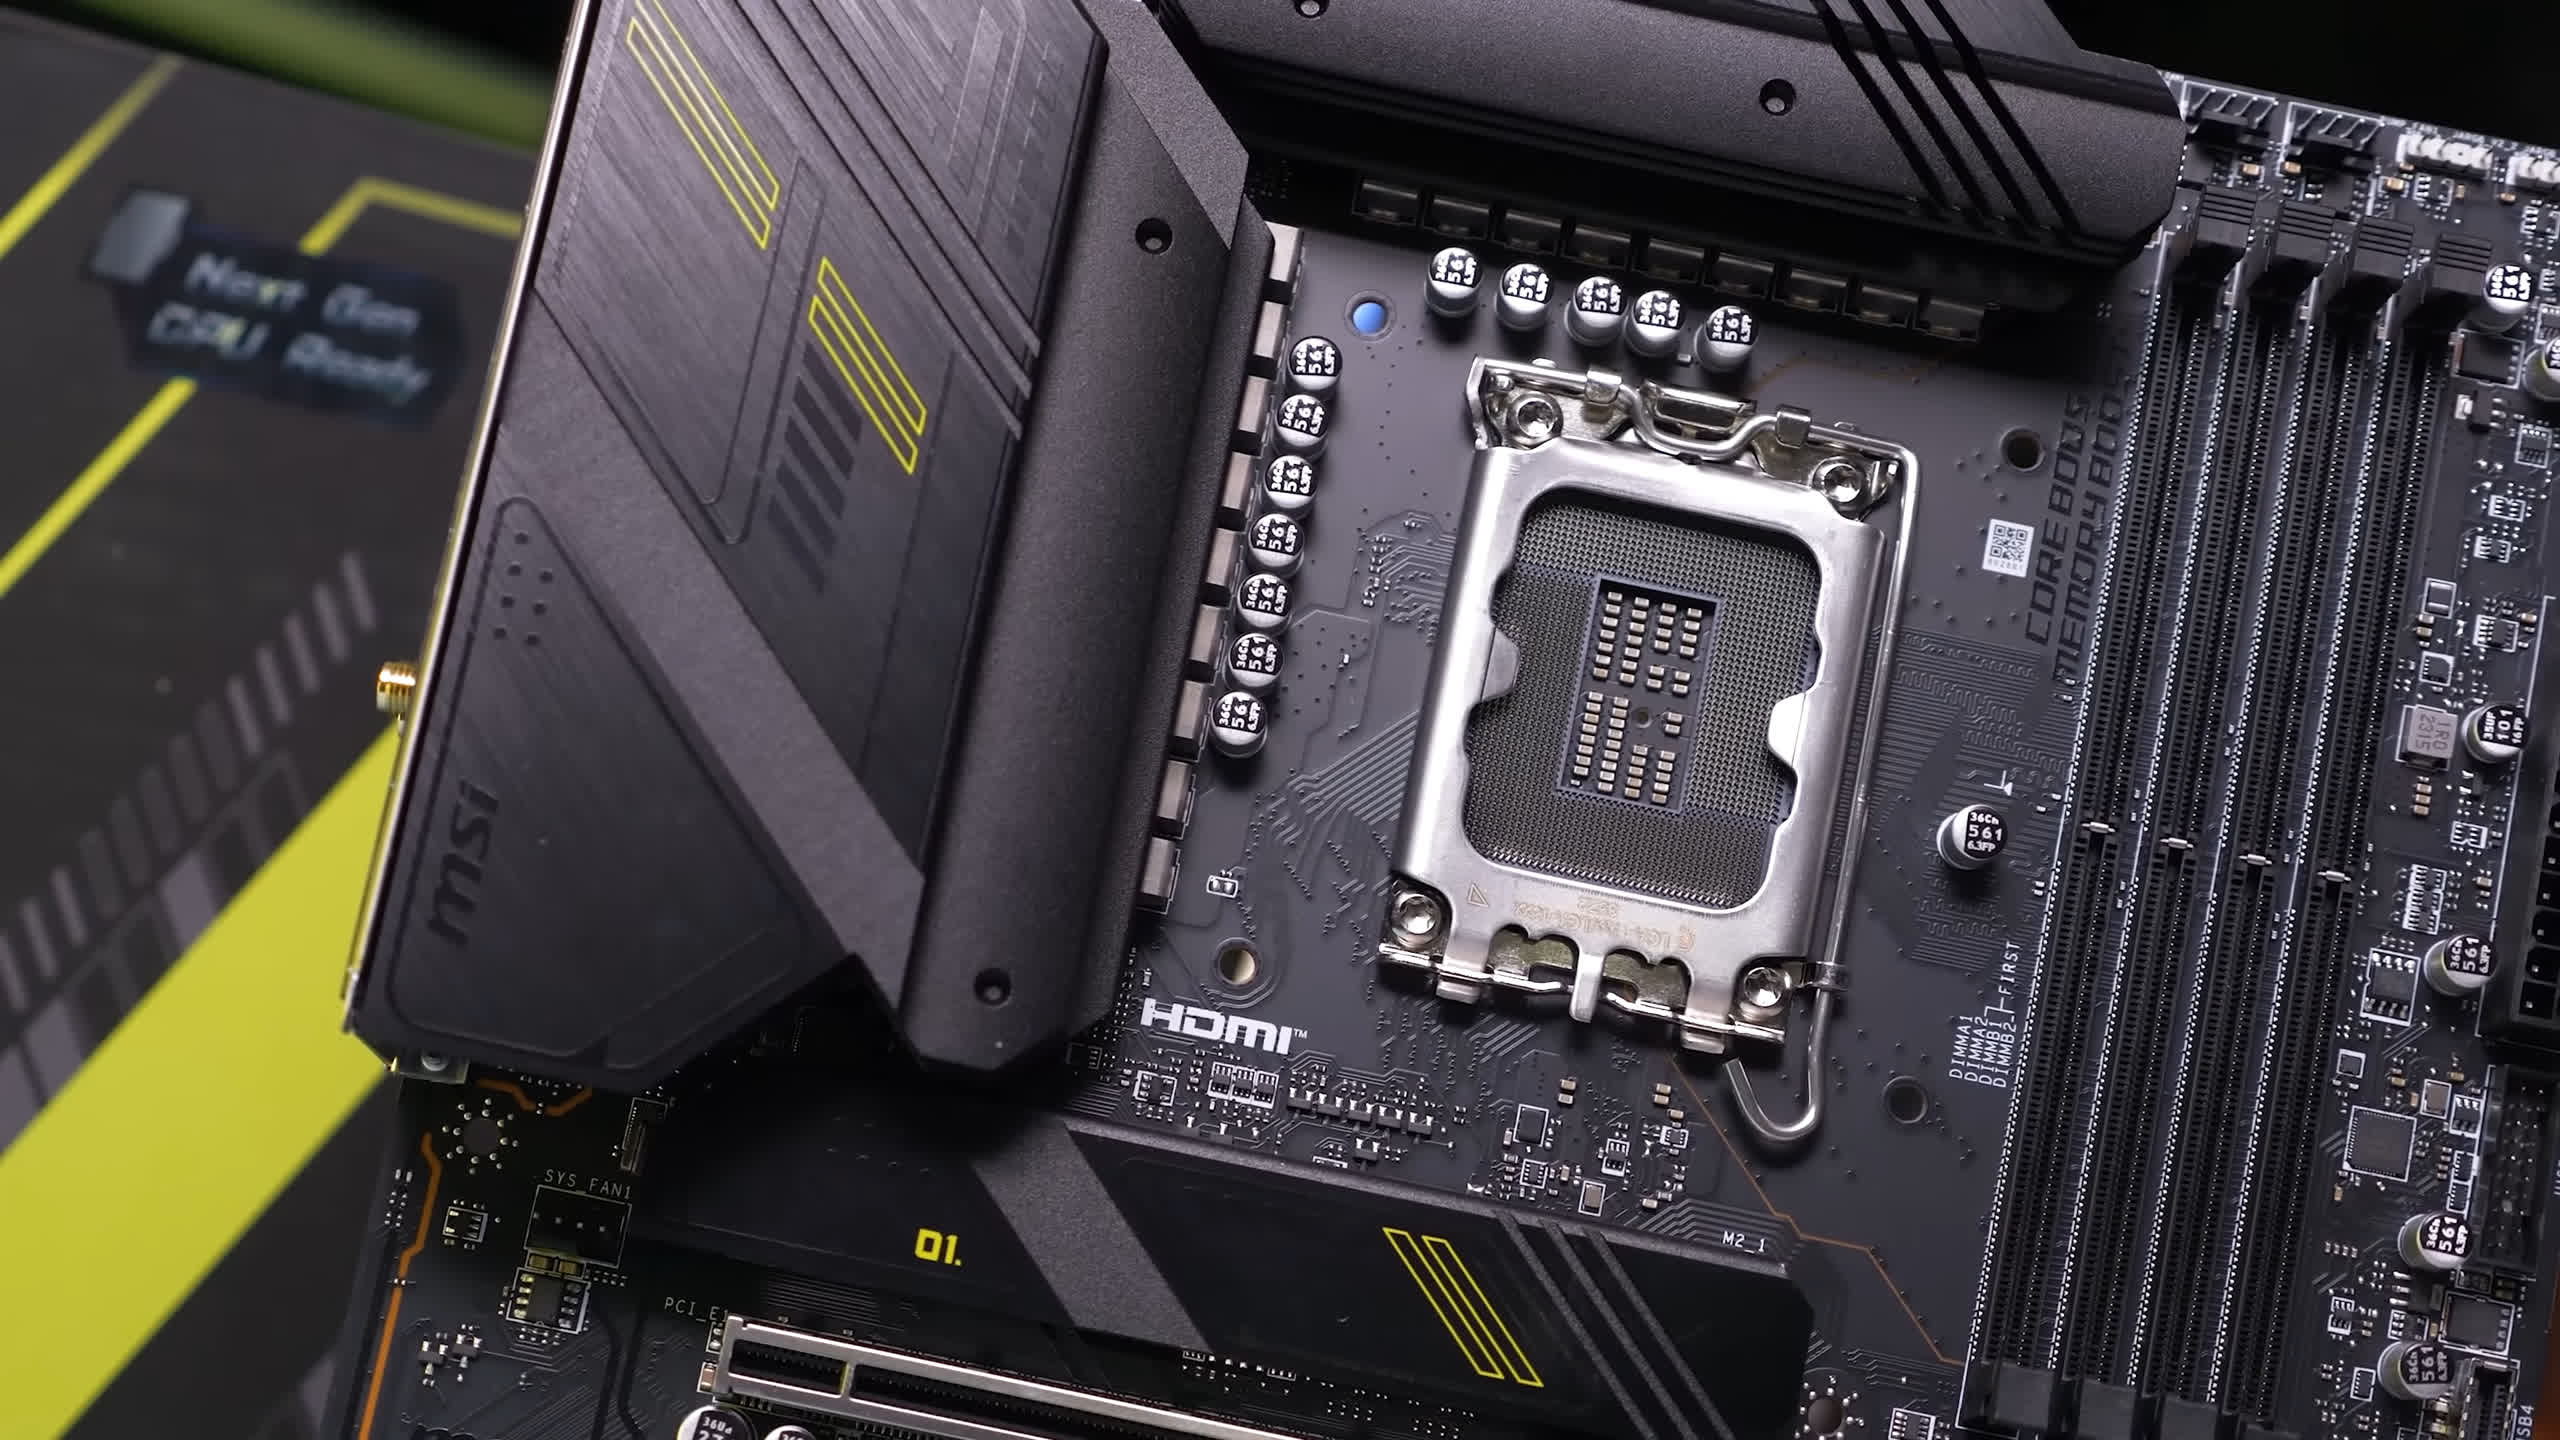
For testing, we’re using the MSI MPG Z790 Carbon WiFi motherboard with BIOS version 7D89v1C2, and the Core i9-14900K paired with DDR5-7200 CL34 memory. The Ryzen 7 7800X3D will be paired with 32GB of DDR5-6000 CL30 memory. The reason we’ve chosen faster memory for Intel is that all LGA1700 CPUs we’ve tested work perfectly with 7200 memory, while AM5 processors are limited to DDR5-6000 for optimal performance. This allows for a 1:1 ratio with the memory controller and DRAM, which AMD claims is the ‘sweet spot’ for Zen 4 processors.
Finally, in total, we’ve tested 24 games using the RTX 4090 at 1080p, 1440p, and 4K. We’ll go over the individual data for about half a dozen games tested before diving into the breakdown graphs. Let’s get to it…
Benchmarks
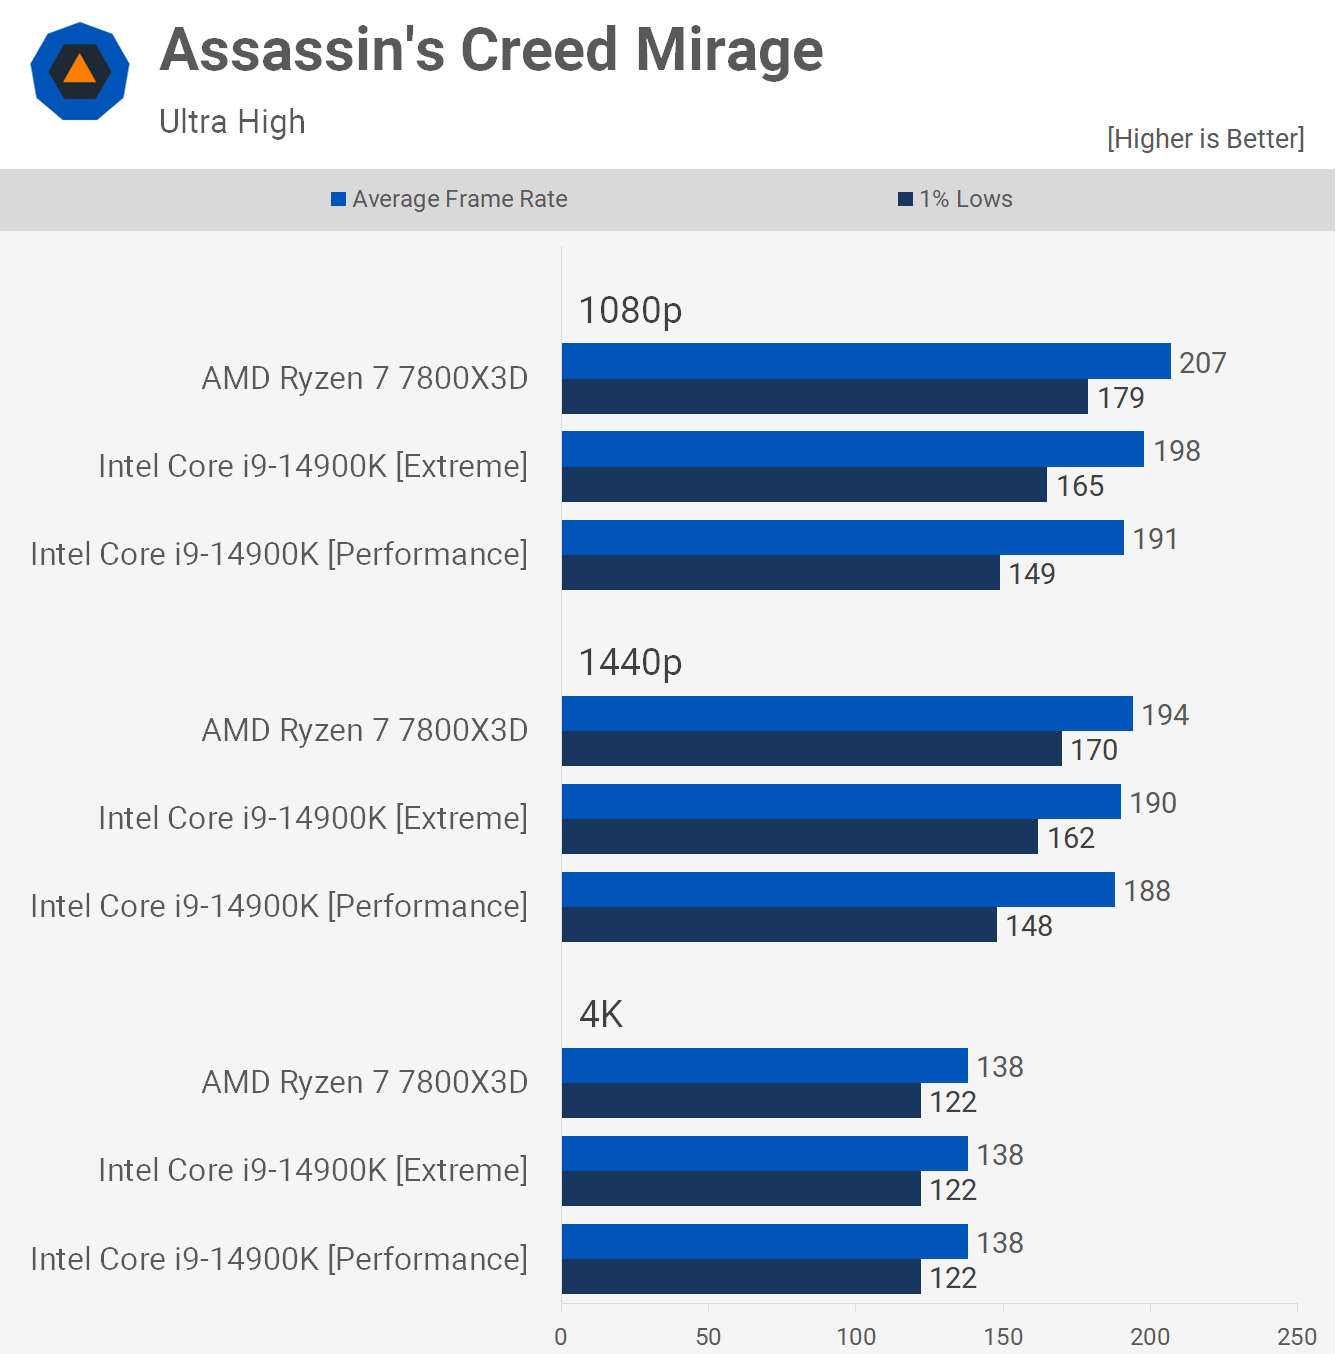
We’ll start by looking at the Assassin’s Creed Mirage results. Here we see that when using the extreme profile, at 253 watts, the 14900K is just 4% slower than the 7800X3D, or 8% slower when looking at the 1% lows.
When using the ‘performance’ profile, the average frame rate of the 14900K drops by a further 4%, but it’s the 1% lows that suffer the biggest hit, dropping by 10%. This means the 7800X3D is on average 8% faster than the power-limited 14900K using the performance profile, and up to 20% faster when comparing 1% lows.
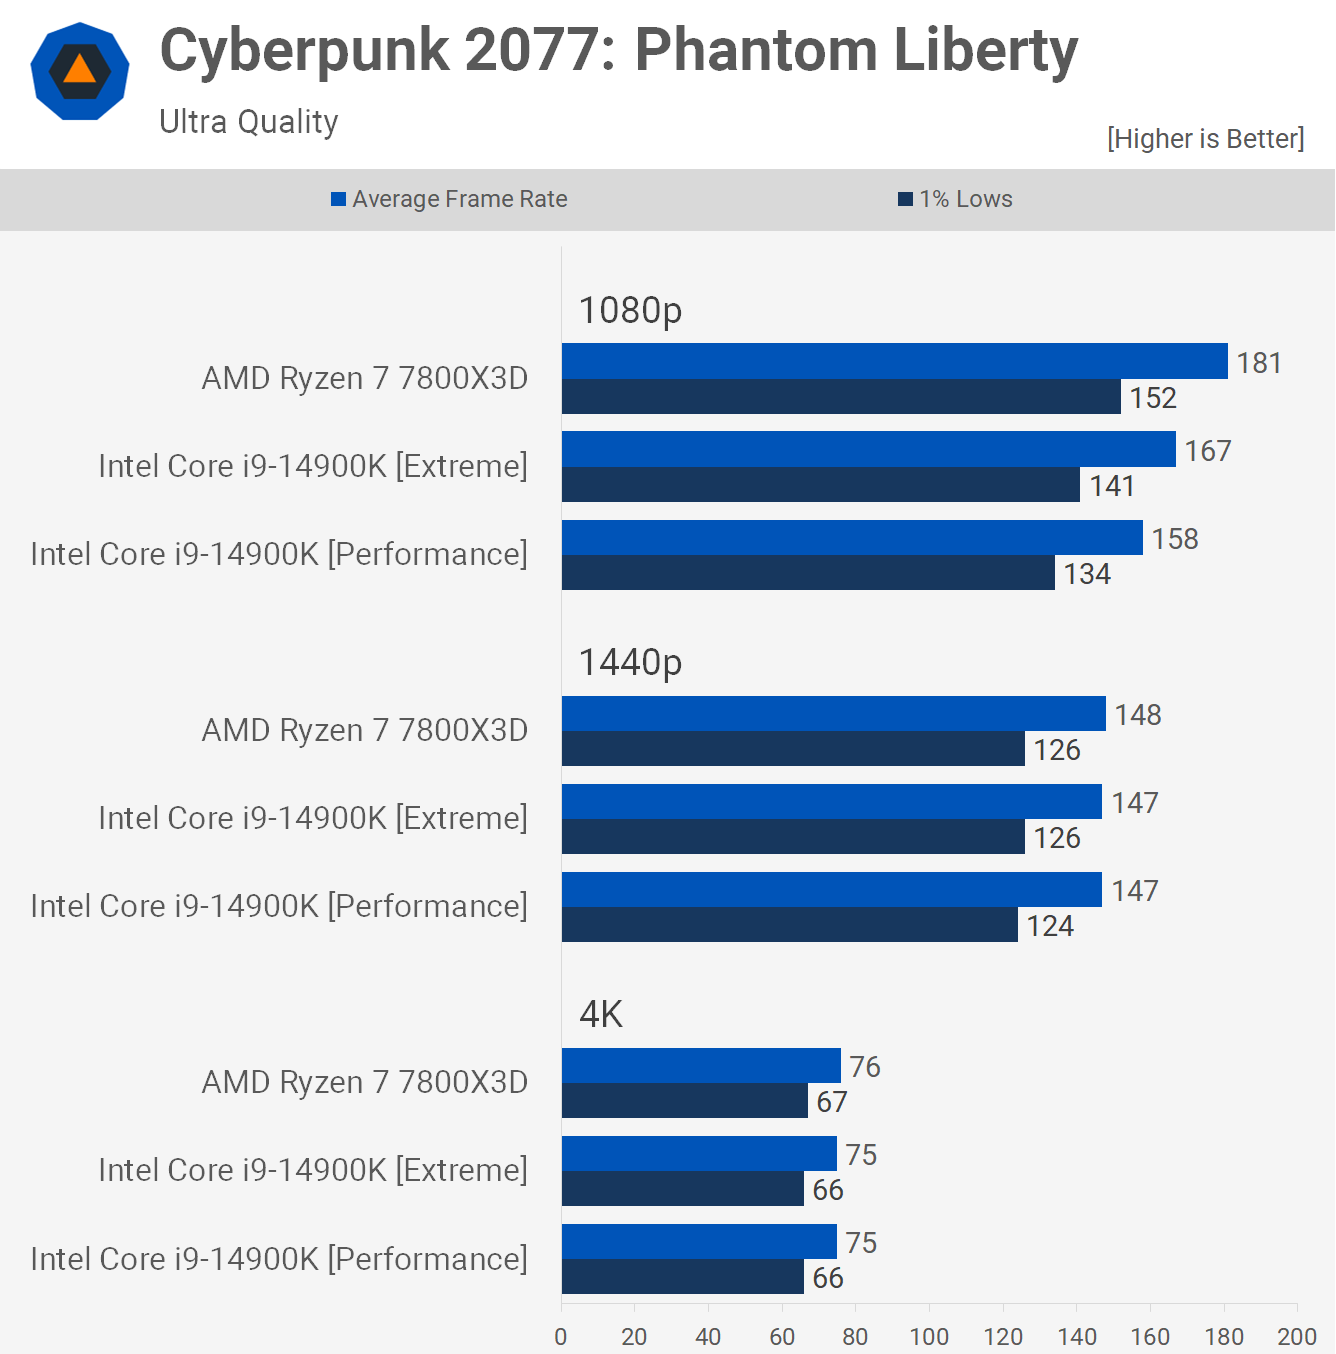
Moving on to Cyberpunk 2077, we find that the 7800X3D is 8% faster than the 14900K using the extreme profile, and 15% faster when limiting the Intel processor to the performance profile. That means we’re seeing around a 5% reduction in performance for the i9 when using the performance profile.
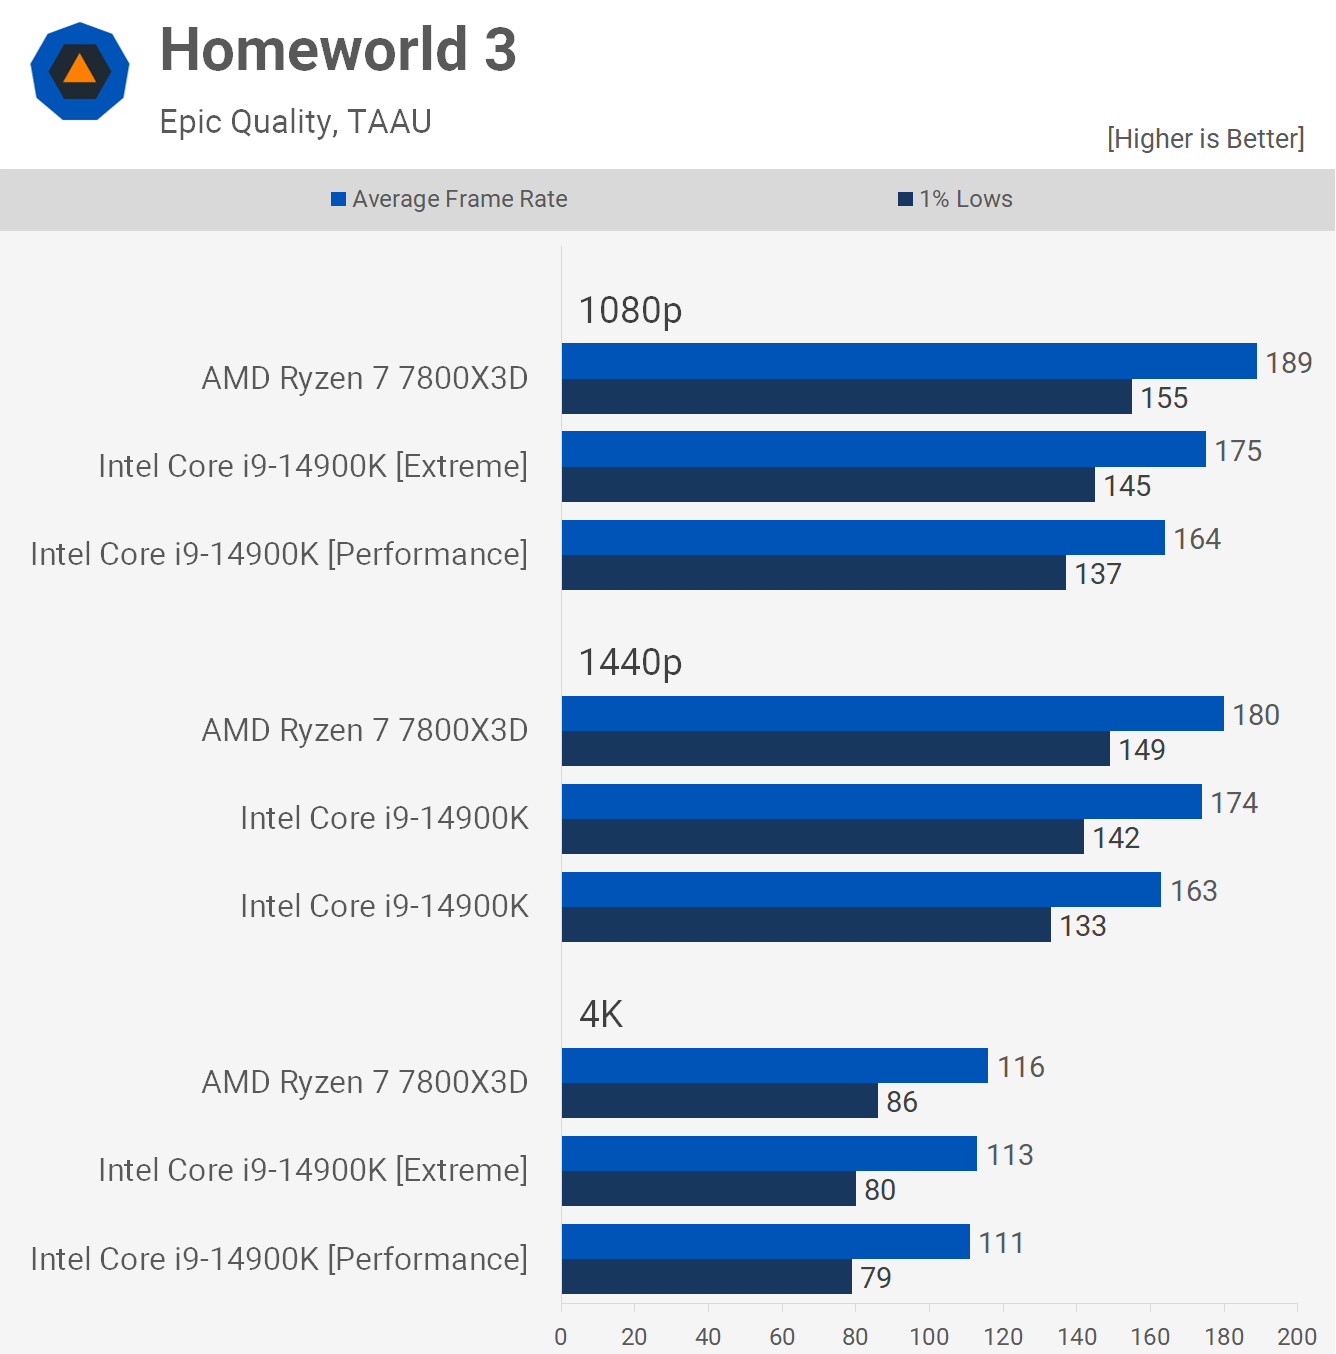
Next up, we have Homeworld 3. Here, the 7800X3D leads the 14900K by an 8% margin, or 15% if we limit the i9 to the performance profile. This means there’s a reasonable 7% uplift from ‘performance’ to ‘extreme’ for the 14900K.


